Rental Vacancy Rates
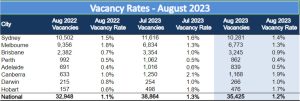
SQM Research has recorded that the national residential property rental vacancy rate has fallen to 1.2% as at the month of August 2023. Brisbane’s vacancy rate decreased slightly from 1% to 0.9%. However, Brisbane CBD recorded an increase in the rental vacancy rate, standing at 1.8%.
Asking Rents
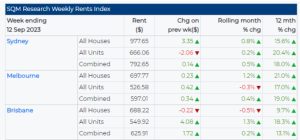
Over the past 30 days leading to 12 September 2023, capital city asking rents rose by 0.2% with the 12-month rise standing at 16.1%. Brisbane house rents decreased slightly by 0.5% and have recorded a 12-month increase of 9.7%. Unit rents have continued to increase by 1.3% with an annual recorded increase of 18.3%.
Louis Christopher, Managing Director of SQM Research said: “Over the first half of 2023, there was a mini reprieve for tenants due to a modest lift in rental vacancy rates, especially for our regional townships. Tenants increasingly sharing accommodation together somewhat assisted in the easing. However, in more recent months, the rental market has tightened once again. This renewed tightening mostly likely was caused by ongoing and rapid increases in our population plus a decrease in new dwelling completions compared to 2022. Going forward, I expect the low rental vacancy market to be maintained. In response to shortages, housing formation will continue to contract and unfortunately, I am expecting a very large increase in homelessness.”
Property Value
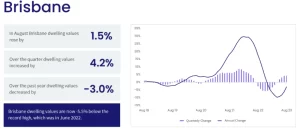
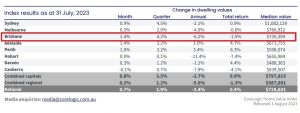
CoreLogic Home Value Index shows housing recovery have gained momentum in August as national home values marked a sixth consecutive monthly rise, up 0.8%. Brisbane is leading the gains by an increase of 1.5%. Brisbane has also posted a strong recovery with values up 6.2% since bottoming out in February. House values rather than unit values have showed a sharper recovery trend.
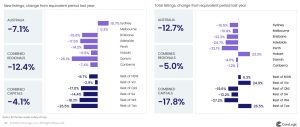
Lower than average advertised supply levels remain a key factor supporting upwards pressure on home values. Advertised supply remains remarkably low in Brisbane. New sales listings are trending 13.3% lower, and total listings are 23.8% lower compared to this time last year.
Median days on market
The amount of time it takes to sell property trended slightly lower through the three months to August in Brisbane, from 25 days during the previous reporting period to 23 days.
Tailwinds that may support further growth:
With inflation reducing faster than forecasted, cost of living pressures is becoming less significant, and the risk of higher interest rates has subsided. The combination of lower inflation and a growing expectation that interest rates have peaked should gradually boost consumer sentiment, helping to support high commitment decision making such as buying or selling a home.
Unemployment is forecast to hold below average levels. Although labour markets are forecast to loosen, unemployment is expected to remain well below the decade average of 5.4%.
Housing demand from strong population growth is set to remain a feature over the coming years, and we are yet to see any material supply response. Net overseas migration is expected to hold at above average levels over the coming years, underpinning housing demand against a backdrop of persistently low dwelling
approvals. The latest estimates from NHFIC forecast Australia’s housing sector will be undersupplied by around 175,000 dwellings by 2027 which will be another factor supporting housing prices over time.
Suburb highlights – Eight Mile Plains
Last month Eight Mile Plains had 46 properties (less than previous month) available for rent and 65 properties for sale.
Median property prices over the last year range from $1,157,500 for houses to $535,000 for units. Based on five years of sales, Eight Mile Plains has seen a compound growth rate of -4.0% for houses and 8.9% for units.
Rentals: houses in Eight Mile Plains rent out for $650 PW with an annual rental yield of 3.3% and units rent for $550 PW with a rental yield of 5.1%.
Unit values and rental yield consistently increased in Eight Mile Plains.
Sources:
SQM Research. (2023). August Vacancy Rate drops to 1.2%. Available from:
https://sqmresearch.com.au/uploads/12_09_23_National_Vacancy_Rate_August_2023_Final.pdf
CoreLogic. (2023). Hedonic Home Value Index. Available from:
https://www.corelogic.com.au/__data/assets/pdf_file/0018/17523/CoreLogic-HVI-Sep-2023-FINAL.pdf
CoreLogic. (2023). Monthly Housing Chart Pack. Available from:
